
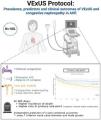


Multimodal assessment of congestion and venous excess ultrasound protocol (VExUS) play a determinant role for volume assessment and decongestive therapy in patients with acute heart failure (AHF).
MethodsProspective, unicentrical and observational study in patients admitted for AHF at the Internal Medicine ward, designed to explore the prevalence, predictors and clinical outcomes of congestion (VExUS score) and the prevalence of congestive nephropathy.
ResultsA total of 100 patients were included (mean age 86±8 years were and 51% females). According to VExUS protocol, 49% exhibited moderate to severe congestion (VExUS 2-3). These patients were more clinical congested, showed higher concentrations of CA125 and microalbumin/creatinine ratio, and need greater doses of loop diuretics during hospitalization. The prevalence of congestive nephropathy on admission was 38%. Patients with VExUS score on admission ≥ 2 had a 2.5-fold increased risk for all-cause mortality and/or HF hospitalization at 1year (OR 2.52, 95% CI 1.02–6.26, p=0.046). In multivariable analysis elevated urea levels, larger inferior vena cava diameter and male gender, were identified as independent predictors on top of VExUS score for one-year mortality with an area under the curve for the final model of 0.740 (p<0.001).
ConclusionsModerate to severe congestion (VExUS grade 2-3) is associated with higher clinical congestion scores, greater need for diuretic treatment, and worse clinical outcomes, including increased mortality and rehospitalization rates in AHF. Furthermore, one-third of AHF showed congestion nephropathy a situation with clinical relevance that can influence decongestive treatments and final outcomes.
La evaluación multimodal de la congestión y el protocolo ecográfico de exceso venoso (VExUS) desempeñan un papel determinante en la evaluación del volumen y la terapia descongestiva en pacientes con insuficiencia cardíaca aguda (ICA).
MétodosEstudio prospectivo, unicéntrico y observacional en pacientes ingresados por ICA en la planta de Medicina Interna, diseñado para explorar la prevalencia, los predictores y los resultados clínicos de la congestión (puntuación VExUS) y la prevalencia de la nefropatía congestiva.
ResultadosSe incluyeron 100 pacientes (edad media de 86±8 años, 51% mujeres). Según el protocolo VExUS, el 49% presentó congestión moderada a grave (VExUS 2−3). Estos pacientes presentaron mayor congestión clínica, mayores concentraciones de CA125 y un cociente microalbúmina/creatinina, y requirieron mayores dosis de diuréticos de asa durante la hospitalización. La prevalencia de nefropatía congestiva al ingreso fue del 38%. Los pacientes con una puntuación VExUS al ingreso ≥ 2 tuvieron un riesgo 2,5 veces mayor de mortalidad por cualquier causa y/o hospitalización por IC al año (OR 2,52; IC del 95%: 1,02-6,26; p=0,046). En el análisis multivariable, los niveles elevados de urea, el mayor diámetro de la vena cava inferior y el sexo masculino se identificaron como predictores independientes, además de la puntuación VExUS, para la mortalidad a un año, con un área bajo la curva para el modelo final de 0,740 (p<0,001).
ConclusionesLa congestión moderada a grave (VExUS grado 2-3) se asocia con puntuaciones de congestión clínica más altas, mayor necesidad de tratamiento diurético y peores resultados clínicos, incluyendo un aumento de la mortalidad y las tasas de rehospitalización en la ICA. Además, un tercio de los casos de ICA presentaron nefropatía por congestión, una situación clínicamente relevante que puede influir en los tratamientos descongestivos y los resultados finales.

Heart failure (HF) is the leading cause of hospitalization in Europe and the United States.1 One-third of HF patients are discharged with residual congestion, a situation related to worse outcomes.2 Detecting vascular and tissular congestion in HF patients is challenging, especially in those with advanced HF and a high prevalence of comorbidities. Thus, grading congestion during admission is the key to adjust diuretic treatment and avoid residual congestion at discharge.3,4
Point-of-care ultrasound assessment has demonstrated its value in assessing vascular and tissue congestion during admissions.5 The inferior vena cava (IVC) and lung ultrasound-guided therapy in AHF trial (CAVAL US-AHF)6 provide evidence of using ultrasound to guide treatment and achieve decongestion to decrease events after discharge. On the other hand, Beaubin-Souigny et al.7 proposed the VExUS protocol as a valuable tool to evaluate congestion, this tool has been validated in type one cardiorenal syndrome and has also been proposed to implement intravenous treatment when congestive nephropathy8(CN) is present. In this context, detecting CN through altered venous flow has been described as an independent predictor of HF hospitalizations and cardiovascular death.9 However, there is no universally stablished definition,10 in general, CN is considered a potentially reversible form of renal dysfunction driven by increased renal interstitial pressure due to congestion. Diagnosis CN requires a comprehensive approach that considers hemodynamic factors as renal venous flow, alongside cardiorenal biomarkers like glomerular filtration rate and proteinuria.
This study aims to: 1) Assess congestion status on admission in patients with AHF through VExUS protocol; 2) Describe baseline characteristics according to VExUS score on admission; 3) Assess the prevalence of CN on admission and baseline characteristics; 4) Assess the prognostic value of VExUS protocol and other markers of congestion and diuretic response related to AHF (See Graphical abstract).
MethodsStudy populationObservational and prospective study carried out at the Internal Medicine Ward of a tertiary hospital between 2022 and 2024. Inclusion criteria were: 1) Age>18 age years old. 2) N-terminal pro-brain Natriuretic Peptide (NT-proBNP)>1000pg/mL. 3) Signs and symptoms of congestion due to HF. 4) Informed consent signed. Exclusion criteria were: 1) Intensive care previous admission. 2) Impaired cognitive or functional status. 3) End-stage kidney disease (dialysis/renal transplant). 4) Advanced Chronic obstructive pulmonary disease, defined as forced expiratory volume in one second (FEV1) <30%.
Multimodal assessment of congestionAssessment of congestion was performed through different methods during the first 24h of admission. Clinical congestion was calculated according to a simplified clinical congestion score3 (Supplementary material, Table S1). Tissular lung congestion was quantified by the identification of significant B lines (≥3 lines) in each quadrant explored (8 in total) and pleural effusion presence. Vascular congestion was estimated by the analysis of the IVC morphology, and both inspiratory and expiratory diameter were calculated through the “M” mode. VExUS protocol was calculated according to Beaubin-Souigny et al.7 Patients were classified on admission as “low vascular congestion” if the total VExUS score was 0-1 and “high vascular congestion” if the VExUS score grade was 2 and 3.
All ultrasound measurements were performed with a “Mylab Omega” ultrasound using sectorial and curvilinear probe (Esaote©) by two researchers with large experience in multimodal assessment of congestion in HF. In the case of low-quality images or not typical venous flow patterns, both physicians discussed the case. In case of discordance between both researchers, the explorations were censured.
Congestive nephropathy was defined as an estimated Glomerular Filtration Rate by CKD-EPI-Creatinine (eGFR)<60mL/min/1.73m2 and/or microalbuminuria>30mg/gr in the presence of a non-continuous renal venous pattern (grades II and III).
Laboratory analysisA complete blood test analysis was performed on the first morning after admission. NT-proBNP and CA125 were determined (Roche Elecsys® NT-proBNP and ®CA 125 assay). Urinary biomarkers were determined from urinary spot samples collected between two and three hours after the first bolus of endovenous morning furosemide, on the day of admission.
Statistical analysisContinuous variables were expressed as the mean±standard deviation or median [Interquartile range] accordingly to the Saphiro-Wilk normality test. Qualitative variables were expressed as percentages.
Baseline patient characteristics were first stratified based on VExUS grading and second, based on the presence of CN. The distinction between groups was evaluated by appropriately using the one-way ANOVA or the Kruskal-Wallis H test for continuous variables and the chi-squared test for categorical variables.
The primary endpoint was the composite of all-cause mortality and/or HF readmissions at 365 days. The difference between groups for the primary outcome was studied with Kaplan-Meier curves and log-rank tests. Potential predictors for the primary end-point were identified through univariate and multivariate logistical regression analyses. List of candidate variables for multivariate analysis, were considered with a p-value ≤0.2 in descriptive analysis between the deceased and surviving groups at 365 days, and variables for which prior biological plausibility had been described.
Estimates are presented with 95% confidence intervals. p-Value<0.05 was considered statistically significant. All analyses were carried out using statistical packages of Python programming language. The study was carried out in compliance with the recommendations contained in the international declaration of Helsinki and approved by the Aragon Health Research Ethics Committee.
ResultsA total of 102 patients were initially recruited for the primary analysis. Two patients were initially excluded from the analysis due to a lack of VExUS score data on admission. The final population included for the analysis was 100 AHF patients with an average age of 86 years old (8), a slightly higher proportion of female gender (51.0%), and a high prevalence of comorbidities, being hypertension (87%), atrial fibrillation (74%) and dyslipidemia (57%) the more prevalent. More than half have been previously admitted for AHF (58%), with a median left ventricular ejection fraction of 54% (17) (Table 1).
Baseline characteristics according to significant systemic venous congestion by Venous Excess Ultrasound protocol (VExUS) on admission.
| Variables | Total | VExUS 0-1 | VExUS 2-3 | p-Value |
|---|---|---|---|---|
| N (%) | 100 | 51 | 49 | |
| Age (years) | 86 (8) | 85 (9) | 87 (7) | 0.538 |
| Women (%) | 51 (51.0) | 29 (56.9) | 22 (44.9) | 0.232 |
| LVEF (%) | 54 (17) | 55 (11) | 50 (20) | 0.388 |
| Comorbidities (%) | ||||
| 58 (58) | 23 (45.1) | 35 (71.4) | 0.008 |
| 87 (87) | 41 (80.4) | 46 (93.9) | 0.045 |
| 74 (74) | 36 (70.6) | 38 (77.6) | 0.427 |
| 36 (36) | 19 (37.3) | 17 (34.7) | 0.790 |
| 25 (25) | 14 (27.5) | 11 (22.4) | 0.564 |
| 22 (22) | 10 (19.6) | 12 (24.5) | 0.556 |
| 36 (36) | 16 (31.4) | 20 (40.8) | 0.325 |
| 57 (57) | 24 (47.1) | 33 (67.3) | 0.041 |
| 18 (18) | 7 (13.7) | 11 (22.4) | 0.256 |
| 14 (14) | 3 (5.9) | 11 (22.4) | 0.017 |
| HF Treatment (n [%]) | ||||
| 73 (73) | 32 (62.7) | 41 (83.7) | 0.018 |
| 60 (40) | 60 (40) | 80 (60) | 0.098 |
| 21 (21) | 10 (20) | 11 (22.4) | 0.766 |
| 12.5 (12.5) | 12.5 (12.5) | 12.5 (12.5) | 0.956 |
| 26 (29.5) | 8 (17.4) | 18 (42.9) | 0.009 |
| 52 (52) | 34 (66.7) | 18 (36,7) | 0.003 |
| 7 (7) | 1 (2.0) | 6 (12.2) | 0.044 |
| 66 (66) | 33 (64.7) | 33 (67.3) | 0.780 |
| 19 (19) | 6 (11.8) | 13 (26.5) | 0.060 |
| N (%) | 100 | 51 | 49 | |
| Clinical Congestion n (%) | ||||
| 0.009 | |||
| 34 (34.3) | 23 (46.0) | 11 (22.4) | |
| 29 (29.3) | 13 (26.0) | 16 (32.7) | |
| 28 (28.3) | 8 (16.0) | 20 (40.8) | |
| <0.001 | |||
| 27 (27.3) | 16 (32.0) | 11 (22.4) | |
| 34 (34.3) | 19 (38.0) | 15 (30.6) | |
| 17 (17.2) | 1 (2.0) | 16 (16.2) | |
| 0.019 | |||
| 16 (16.2) | 8 (16.0) | 8 (16.3) | |
| 53 (69.7) | 33 (66.0) | 20 (40.8) | |
| 30 (30.3) | 9 (18.0) | 21 (42.9) | |
| 4 (3) | 4 (2) | 5 (2) | <0.001 |
| Interstitial lung congestion n (%) | ||||
| Total of lung quadrants with significant b lines (≥3) | 7 (4) | 6 (4) | 8 (2) | 0.181 |
| Presence of pleural effusion | 54 (54) | 27 (58.7) | 27 (64.3) | 0.591 |
| Intravascular congestion | ||||
| IVC diameter (mm) | 22 (5) | 20 (5) | 23 (6) | <0.001 |
| IVC colapsability (n [%]) | 23 (23) | 19 (38.0) | 4 (8.5) | <0.001 |
| Suprahepatical Doppler vein analysis (n [%]) | <0.001 | |||
| 21 (23) | 20 (40) | 1 (2.4) | |
| 39 (43) | 29 (58) | 10 (24) | |
| 31 (34) | 1 (2) | 30 (73) | |
| Portal doppler vein analysis (n [%]) | <0.001 | |||
| 30 (33) | 24 (47) | 6 (15) | |
| 34 (37) | 23 (45) | 11 (27) | |
| 27 (30) | 4 (7) | 23 (57) | |
| Renal Doppler vein analysis (n [%]) | <0.001 | |||
| 54 (58) | 37 (78) | 17 (37) | |
| 30 (32) | 9 (19) | 21 (45) | |
| 9 (10) | 1 (2) | 8 (17) | |
| Biomarkers | ||||
| NT-proBNP (pg/mL) | 5574 (10,066) | 5201 (5548) | 7560 (12,183) | 0.105 |
| CA125 (U/mL) | 46.3 (75.6) | 32.7 (75.2) | 53.2 (73.8) | 0.045 |
| Blood parameters | ||||
| Uric acid (mg/dL) | 7.28±2.38 | 7.12±2.20 | 7.42±2.55 | 0.765 |
| Urea (mg/dL) | 60 (42) | 55 (35) | 66 (44) | 0.120 |
| Creatinine (mg/dL) | 1.23 (0.73) | 1.19 (0.81) | 1.27 (0.60) | 0.339 |
| eGFR (mL/min/1.73m2) | 50 (28) | 52.5 (28.9) | 50.2 (25.5) | 0.611 |
| Sodium (mmol/L) | 142 (4) | 141 (5) | 141 (3) | 0.750 |
| Potassium (mmol/L) | 4.0 (0.5) | 4.0 (0.5) | 4.0 (0.6) | 0.361 |
| Chloride (mmol/L) | 101 (5) | 101 (5) | 101 (6) | 0.877 |
| Urinary sodium (mmol/L) | 93 (50) | 93 (40) | 92 (53) | 0.736 |
| Urinary chloride (mmol/L) | 89 (56) | 93 (54) | 84 (57) | 0.534 |
| Urinary pottasium (mmol/L) | 23 (11) | 20 (9) | 25 (14) | 0.027 |
| Microalbuminin/Creatinine ratio (mg/g) | 105 (210) | 80 (99) | 130 (230) | 0.007 |
| Hemoglobin (g/L) | 12.1 (3.0) | 11.8 (3.1) | 12.4 (2.8) | 0.350 |
| Hematocritum (%) | 36 (8) | 36 (9) | 38 (8) | 0.294 |
| C-Reactive Protein (mg/dL) | 16 (32) | 18 (48) | 15 (24) | 0.834 |
| Total endovenous furosemide | 415 (580) | 240 (346) | 545 (895) | 0.001 |
| Outcomes | ||||
| 28 (28) | 10 (10) | 18 (10) | 0.048 |
| 18 (18) | 7 (7) | 11 (11) | 0.327 |
| 35 (35) | 17 (17) | 29 (29) | 0.046 |
ACEi: angiotensin-converting enzyme inhibitors; ACM: all-cause mortality; ARB: angiotensin receptor blockers; CA125: cancer antigen 125; CKD: chronic kidney disease; COPD: chronic obstructive pulmonary disease; eGFR: estimated glomerular filtration rate; HF: heart failure; HFpEF: heart failure with preserved ejection fraction; ICD: ischaemic coronary disease; IV: intravenous; IVC: inferior vena cava; JVD: Jugular venous distention; LVEF: left ventricular ejection fraction; MRA: mineralocorticoid receptor antagonist; NT-proBNP: N-terminal pro b-type natriuretic peptide; iSGLT2: sodium-glucose co-transporter-2 inhibitors; UACR: urine albumin-to-creatinine ratio; VEXUS: venous excess ultrasound.
According to VExUS protocol on admission, 51% of the patients had low vascular congestion (VExUS 0-1) and 49% had high vascular congestion (VExUS 2-3). Patients with high vascular on admission had a higher prevalence of chronic HF (71.4% vs 45.1%; p=0.008), a higher prevalence of hypertension (93.9% vs 80.4%; p=0.045) and dyslipidemia (67.3% vs 47.1%; p=0.041), and had pacemakers in a higher proportion (22.4% vs 5.9%; p=0.017). According to HF treatment, patients with high vascular congestion were treated with higher proportion of oral loop diuretics (83.7% vs 62.7%; p=0.018), sodium-glucose cotransporter-2 inhibitors (SGLT2i) (42.9% vs 17.4%; p=0.009), angiotensin receptor/neprylisin inhibitor (12.2% vs 2.0%; p=0.044) and non-significant higher prescription of antagonist mineralocorticoid receptor blockers (26.5% vs 11.8%; p=0.060) (Table 1).
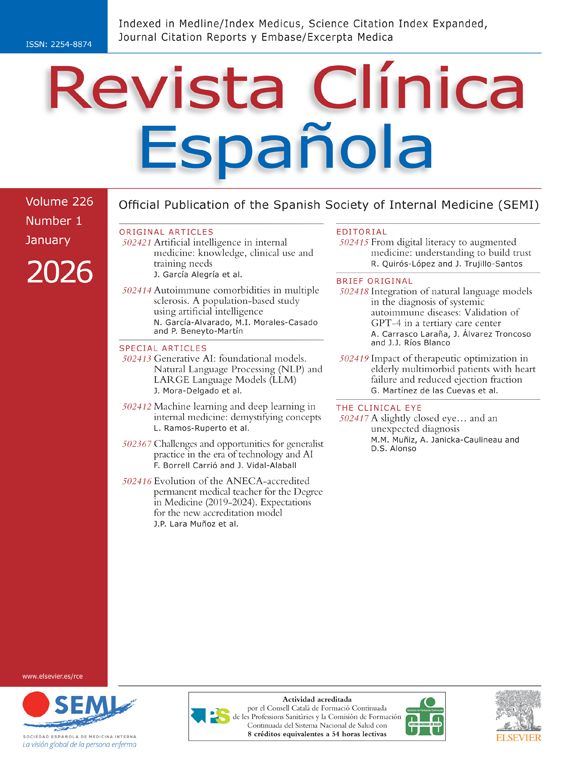
Patients with high vascular congestion, showed a higher rate clinical congestion score (5 points [2] vs 4 points [3]; p=<0.001) and higher concentrations of cancer antigen 125 (CA125) (53 [73] U/mL vs 32 [75] U/mL; p=0.045). No differences were identified according to renal function (50.2 [25] mL/min/1.73m2 vs 52.5 [28] mL/min/1.73; p=0.611) or natriuresis (92 [53] mmol/L vs 93 [40] mmol/L; p=0.736), but higher rates of microalbuminuria/creatinine ratio were detected in those patients with higher VExUS scores (130 [230] mg/g vs 80 [99] mg/g; p=0.027). Finally, high vascular congestion group patients needed higher significant doses of endovenous furosemide during the first 72h after admission (545 [895] mg vs 240 [346] mg; p=0.001) (Table 1 & Fig. 1).
Baseline characteristics according to congestive nephropathy at admission
A total of 95 patients were finally included to evaluate the presence of CN. A prevalence for CN of 38% was detected in our population on admission. Baseline characteristics were similar across both groups, although CN patients’ trend to be treated in a lower proportion with angiotensine conversor enzyme inhibitors (ACEi) and mineralocorticoid receptor antagonists (MRA) (43.2% vs 61.4%; p=0.084). According to multimodal congestion assessment, CN patients showed significant higher rates of clinical congestion score (p=0.004), particularly in terms of presence of significant edemas (p=0.023) and jugular vein distension (p=0.001). Doppler vein analysis of suprahepatic veins and portal vein confirmed a significant presence of hepatical congestion (p<0.001 and p<0.001, respectively), and higher VExUS grade (p<0.001) (Supplementary material, Fig. S1. Congestion biomarkers were also higher in CN patients, with median concentrations of NT-proBNP on the admission of 7851 [13063] pg/mL vs 4984 [5935] pg/mL (p<0.025) and median concentrations of CA125 of 47.0 [50] U/mL vs 34.2 [84] U/mL (p-value<0.077). Of note, patients with CN received higher doses of endovenous furosemide during the first 72h after admission (518 [1050] mg vs 280 [453] mg; p=0.010) (Table 2). No significant association was found between CN and long-term outcomes in our cohort.
Baseline characteristics according to congestive nephropathy (CN) on admission.
| Variables | Total | Not CN | CN | p-Value |
|---|---|---|---|---|
| N (%) | 95 | 57 | 38 | |
| Age (years) | 86 (7) | 86 (8) | 87 (7) | |
| Women (%) | 50 (52.1) | 30 (50.9) | 20 (54.1) | 0.763 |
| LVEF (%) | 55 (16) | 57 (15) | 50 (15) | 0.846 |
| Comorbidities (%) | ||||
| 53 (56.4) | 29 (50.9) | 24 (64.9) | 0.182 |
| 82 (87.2) | 49 (86.0) | 33 (89.2) | 0.647 |
| 69 (73.4) | 40 (70.2) | 29 (78.4) | 0.379 |
| 33 (35.1) | 21 (36.8) | 12 (32.4) | 0.662 |
| 23 (24.5) | 16 (28.1) | 7 (18.9) | 0.313 |
| 20 (21.3) | 11 (19.3) | 9 (24.3) | 0.561 |
| 32 (34.0) | 16 (28.1) | 16 (43.2) | 0.129 |
| 56 (59.6) | 33 (57.9) | 23 (62.2) | 0.680 |
| 17 (18.1) | 10 (17.5) | 7 (18.9) | 0.866 |
| 12 (12.8) | 5 (8.8) | 7 (18.9) | 0.150 |
| HF Treatment (n [%]) | ||||
| 67 (71.3) | 39 (68.4) | 28 (75.7) | 0.448 |
| 60 (40) | 60 (40) | 60 (60) | 0.860 |
| 20 (21.5) | 12 (21.4) | 8 (21.6) | 0.982 |
| 0 (12.5) | 0 (12.5) | 0 (12.5) | 0.556 |
| 25 (29.8) | 14 (26.4) | 11 (35.5) | 0.380 |
| 51 (54.3) | 35 (61.4) | 16 (43.2) | 0.084 |
| 6 (6.4) | 2 (3.5) | 4 (10.8) | 0.157 |
| 61 (64.9) | 39 (66.7) | 23 (62.2) | 0.655 |
| 17 (18.1) | 8 (14.0) | 9 (24.3) | 0.205 |
| N (%) | 94 | 57 (60.6) | 37 (39.4) | |
| Clinical Congestion, n (%) | ||||
| 0.670 | |||
| 31 (33.3) | 20 (35.7) | 11 (29.7) | |
| 26 (28.0) | 15 (26.8) | 11 (29.7) | |
| 28 (30.1) | 15 (26.8) | 13 (35.1) | |
| 0.023 | |||
| 22 (23.7) | 13 (23.2) | 9 (24.3) | |
| 33 (35.5) | 22 (39.3) | 11 (29.7) | |
| 17 (18.3) | 5 (8.9) | 12 (32.4) | |
| 0.001 | |||
| 16 (17.2) | 9 (16.1) | 7 (18.9) | |
| 50 (53.8) | 38 (67.9) | 12 (32.4) | |
| 27 (29.0) | 9 (16.1) | 18 (48.6) | |
| 4 (3) | 4 (2) | 5 (3) | 0.004 |
| Interstitial lung congestion n (%) | ||||
| Total of lung quadrants with significant b lines (≥3) | 7 (4) | 7 (4) | 7 (2) | 0.195 |
| Presence of pleural effusion | 51 (60.7) | 33 (62.3) | 18 (58.1) | 0.704 |
| Intravascular congestion | ||||
| IVC diameter (mm) | 22 (5) | 21 (5) | 22 (5) | 0.142 |
| Suprahepatical Doppler vein analysis (n [%]) | <0.001 | |||
| 20 (23.5) | 19 (33.9) | 1 (3.4) | |
| 35 (41.2) | 25 (44.6) | 10 (34.5) | |
| 30 (35.3) | 12 (21.4) | 18 (62.1) | |
| Portal doppler vein analysis (n[%]) | <0.001 | |||
| 29 (34.1) | 27 (48.2) | 2 (6.9) | |
| 31 (36.5) | 18 (32.1) | 13 (44.8) | |
| 25 (29.4) | 11 (19.6) | 14 (48.3) | |
| Renal Doppler vein analysis (n[%]) | <0.001 | |||
| 54 (58.7) | 52 (91.2) | 2 (5.7) | |
| 29 (31.5) | 5 (8.8) | 24 (68.6) | |
| 9 (9.8) | 0 (0.0) | 9 (25.7) | |
| Biomarkers | ||||
| NT-proBNP (pg/mL) | 5534 (9267) | 4984 (5935) | 7851 (13,063) | 0.025 |
| CA125 (U/mL) | 46.8 (76) | 34.2 (84.9) | 47.0 (50.2) | 0.077 |
| Blood parameters | ||||
| Uric acid (mg/dL) | 7.2 (3.9) | 6.9 (2.7) | 7.8 (4.4) | 0.109 |
| Urea (mg/dL) | 59 (41) | 52 (28) | 72 (39) | 0.003 |
| Creatinine (mg/dL) | 1.33 (0.66) | 1.12 (0.56) | 1.39 (0.66) | 0.030 |
| eGFR (mL/min/1.73m2) | 51 (28) | 56 (27) | 42 (23) | 0.004 |
| Sodium (mmol/L) | 142 (3) | 142 (4) | 141 (3) | 0.856 |
| Potassium (mmol/L) | 4.0 (0.5) | 4.0 (0.5) | 4.2 (0.6) | 0.229 |
| Chloride (mmol/L) | 101 (5) | 101 (4) | 101 (7) | 0.816 |
| Urinary sodium (mmol/L) | 93 (48) | 94 (42) | 84 (57) | 0.856 |
| Urinary chloride (mmol/L) | 90 (57) | 90 (52) | 88 (63) | 0.816 |
| Urinary pottasium (mmol/L) | 23 (12) | 21 (10) | 27 (16) | 0.229 |
| Microalbuminin/Creatinine ratio (mg/g) | 105 (208) | 92 (139) | 129 (229) | 0.014 |
| Hemoglobin (g/L) | 12.1 (2.9) | 12.1 (3.3) | 12.2 (2.7) | 0.991 |
| Hematocritum (%) | 37.0 (8.3) | 37 (8) | 37 (8) | 0.908 |
| C-Reactive Protein (mg/dL) | 16 (32) | 16 (29) | 20 (56) | 0.425 |
| Total endovenous furosemide | 400 (555) | 280 (453) | 518 (1050) | 0.010 |
| Outcomes | ||||
| 27 (28.4) | 15 (8.5) | 12 (4.5) | 0.557 |
| 17 (17.8) | 11 (6.2) | 6 (2.2) | 0.662 |
| 24 (25.2) | 9 (5.1) | 15 (5.7) | 0.540 |
ACEi: angiotensin-converting enzyme inhibitors; ACM: all-cause mortality; ARB: angiotensin receptor blockers; CA125: cancer antigen 125; CKD: chronic kidney disease; COPD: chronic obstructive pulmonary disease; eGFR: estimated glomerular filtration rate; HF: heart failure; HFpEF: heart failure with preserved ejection fraction; ICD: ischaemic coronary disease; IV: intravenous; IVC: inferior vena cava; JVD: Jugular venous distention; LVEF: left ventricular ejection fraction; MRA: mineralocorticoid receptor antagonist; NT-proBNP: N-terminal pro b-type natriuretic peptide; iSGLT2: sodium-glucose co-transporter-2 inhibitors; UACR: urine albumin-to-creatinine ratio; VEXUS: venous excess ultrasound.
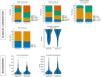
Among the 100 patients finally included, 28 patients died by day 365, and 18 were re-hospitalized because of a new HF rehospitalization. Patients who had high vascular congestion (VExUS score 2-3) on admission, had a higher proportion of the combined primary end-point (HF rehospitalizations and/or all-cause mortality after 365 days) (p=0.048) and Kaplan-Meier plots in Fig. 2 showed a significant rate too (Long-rank test=0.031). The risk for the primary end-point by day 365 more than doubled in patients with higher VExUS scores on admission (Odds ratio 2.52, 95% CI [1.02–6.26]; p=0.046), although after multivariate adjustment, significance for VExUS score was lost on top of strongest variables (Table 3). In the multivariable analysis, elevated urea levels, larger inferior vena cava diameter and male gender, were identified as independent predictors on top of VExUS score for one-year mortality with an area under the curve for the final model of 0.740 (p<0.001).

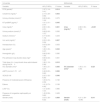
Univariate and multivariate logistic regression analysis by admission parameters for the primary combined end-point (1year—all-cause mortality).
| Univariate | Multivariate | ||||
|---|---|---|---|---|---|
| Variable | HR (CI 95%) | P-Value | Variable | HR (CI 95%) | P-Value |
| CCS (points)a | 1.97 (1.14–3.41) | 0.014 | |||
| Creatinine (mg/dL)a | 2.14 (1.29–3.56) | 0.003 | |||
| Urinary chloride (mmol/L)a | 0.66 (0.42–1.04) | 0.075 | |||
| NT-proBNP (pg/mL)a | 1.61 (1.01–2.57) | 0.045 | |||
| Urea (mg/dL)a | 2.80 (1.60–4.91) | 0.001 | Urea (mg/dL)a | 2.88 (1.56–5.30) | <0.001 |
| Urinary sodium (mmol/L)a | 0.68 (0.43–1.07) | 0.095 | |||
| Sodium (mmol/L)a | 0.77 (0.50–1.19) | 0.244 | |||
| Uric acid (mg/dL)a | 2.09 (1.22–3.59) | 0.007 | |||
| Hematocritum (%) | 0.63 (0.39–1.00) | 0.053 | |||
| Age (years)a | 1.89 (1.05–3.37) | 0.032 | |||
| Hemoglobin (g/L) | 0.66 (0.42–1.05) | 0.080 | |||
| Pre-admission loop diuretic dose (mg)a | 0.66 (0.43–1.02) | 0.061 | |||
| Total dose of iv. Loop diuretic dose administered during first 24h | 1.86 (1.16–2.98) | 0.010 | |||
| IVC diameter (mm)a | 1.99 (1.21–3.27) | 0.006 | IVC diameter (mm)a | 1.94 (1.10–3.39) | 0.021 |
| eGFR (mL/min/1.72m2) | 0.48 (0.29 – 0.82) | 0.006 | |||
| VEXUS II-III | 2.52 (1.02–6.26) | 0.046 | |||
| Presence of moderate/severe Orthopnea | 1.83 (0.74–4.59) | 0.192 | |||
| Edema | 1.81 (0.73–4.45) | 0.199 | |||
| LVEF (%) | 1.01 (0.65–1.57) | 0.980 | |||
| Presence of congestive nephropathy on admission | 1.45 (0.58–3.60) | 0.428 | |||
| Gender (male) | 3.53 (1.35–9.22) | 0.009 | Gender (male) | 4.21 (1.38–12.86) | 0.011 |
Area Under Curve (AUC) of the multivariable logistic regression model 0.740 (p<0.001) (Sensitivity 62.1%; Specificity 86.9%; R2 0.26; Accuracy 78.8%).
In this observational, single-center study conducted in AHF patients, we observed a high proportion (around 50%) of high vascular congestion (VExUS 2-3) at admission. This increased level of congestion correlated with worse outcomes in terms of all-cause mortality and/or HF readmissions within the first year after discharge, reinforcing the value of this tool in the management of AHF patients.
Since its introduction, the VExUS protocol has garnered interest and evidence in critical care settings and, more recently, in HF as a marker of vascular and visceral congestion. In our sample, the degree of vascular congestion assessed by VExUS was elevated, with the most congested patients (VExUS grades 2 and 3) exhibiting more comorbidities and receiving higher doses of diuretic treatment, including furosemide, SGLT2i, and MRA. This finding suggests either a more advanced HF stages or a more intensive decongestive treatment. In this context, diuretic resistance is suggested by the need for higher doses to achieve decongestion, as well as the implementation of sequential nephron blockade. Although absolute creatinine levels did not differ between groups, we believe that creatinine alone does not always reflect nephron functionality. Notably, in our cohort, albuminuria was more prevalent in patients with higher VExUS grades, which may be related to diuretic resistance. Moreover, when analyzing clinical and laboratory parameters, the VExUS protocol correlated well with clinical congestion parameters and biomarkers such as NT-proBNP and CA125, although only CA125 reached statistical significance (likely due to insufficient sample size). While natriuretic peptides are more associated with volume overload and cardiac chamber distention, CA125 appears to be more closely linked with systemic inflammation and extravascular venous congestion, particularly as VExUS captures signs of congestion beyond the vasculature. These findings align with previously published studies on VExUS in HF,7,8,9,11,17 reinforcing the external validity of our results.
However, the most novel and intriguing aspect of our study is related to the detection of congestive nephropathy and diuretic requirements during the initial hours of hospitalization. According to CN definition for this study, almost 40% presented with this condition. These results are consistent with those reported by Espriella et al.,12 although the incidence in our sample was lower, likely due to the absence of a standardized definition of congestive nephropathy.
Nevertheless, these results have significant implications from multiple perspectives. First, they support the hypothesis that congestion is the primary driver of transient renal function deterioration at admission for AHF. Second, in line with previous studies,13,14 our results suggest that microalbuminuria could be useful as a urinary biomarker of clinical congestion. Third, from a mechanistic perspective, our findings highlight the complex pathophysiological interplay of congestion, which acts both as a consequence and a potential cause of organ dysfunction, particularly renal dysfunction, with important therapeutic implications. In this context, the study of intrinsic mechanisms of congestion-induced renal injury suggests a key role for intra-abdominal pressure, which may contribute to the compression of major renal structures.15 This could explain the need for higher diuretic doses (reflecting poorer diuretic response) and more elevated microalbuminuria ratios levels in HF patients with greater degrees of intra-abdominal vascular congestion determined by VExUS. Finally, based on the above, the VExUS protocol could represent a valuable tool for designing tailored decongestive treatment strategies, particularly in patients with CN, where worsening renal function and pseudo-worsening renal function are present and difficult to assess in the clinical setting only through physical examination. In this regard, a recent clinical trial16 showed that VExUS-guided decongestion versus standard of care in patients with cardiorenal syndrome type 1 did not improve the kidney function recovery but improved the odds of achieving decongestion.
Prognosis eventsMortality and readmission rates in HF are generally increasing and risk stratification might be challenging. Torres et al.17 have pointed out the role of ultrasound in assessing prognosis. They identified portal vein pulsatility >50%, monophasic renal pattern and VExUS grade 3 as predictors of in-hospital mortality in patients admitted for HF. Our findings are similar to theirs, showing that VExUS on admission is capable of identifying those patients with higher congestion and worse outcomes in the mid-term. Recently, Espriella et al.12 concluded that discontinuous renal flow identifies higher rates of worsening renal function and increased rates of adverse events. Along the same findings, in the past few months, Sovetova et al.18 published a similar study to ours showing that VExUS grade 3 was strongly associated with worsened renal function, reduced natriuretic response, increased resistance to diuretics and higher incidence of hospital mortality. It also found that monophasic patterns of renal flow and abnormal portal flow had increased risk of adverse events.
However, our data did not support the isolated value of portal flow but renal flow was notably close to reaching statistical significance in the survival regression analysis at one-year follow-up, suggesting a relevant prognostic role that warrants further investigation. Probably this lack of evidence could be due to a limited number of patients with grade 3 alterations, and challenges related to anthropometric factors and the operator-dependent nature of performing ultrasound. However, there is ongoing controversy about the use of renal doppler flow, as some authors argued that this method can be time-consuming,17,19 which contrasts with previous reports highlighting its clinical value. This inconsistency warrants further explanation to better understand its impact and relevance.
Interestingly, no significant association was found between CN and long-term outcomes in our cohort. This divergence from previous studies, such as those by Damman et al.,20,21 who identified CN as a prognostic marker, may stem from differences in patient populations, definitions, or statistical adjustments. Future studies should explore whether tailored interventions targeting CN can modify outcomes.
Multivariate analysis highlights the independent prognostic value of elevated urea levels, increased IVC and male gender in predicting one-year mortality in HF. These findings are consistent with the established role of renal dysfunction and volume overload as key prognostic markers HF. Urea emerged as a significant predictor of outcomes in this study, whereas creatinine did not demonstrate the same prognostic value, which may be attributed to urea’s greater sensitivity to systemic congestion and volume overload. While creatinine is a commonly used marker of renal function, urea levels can reflect changes faster in fluid balance and renal perfusion, as described years ago.22,23 Additionally, male gender was identified as a significant predictor of worse outcomes, potentially due to a higher prevalence of ischemic etiology and comorbidities like diabetes and renal dysfunction.24,25
Interestingly, IVC diameter appears as a significant predictor in the multivariate analysis while VExUS does not, which is controversial given that other studies support VExUS above IVC, as we mentioned before. Maybe it could be explained as the IVC is an objective, unique and easy parameter and VExUS score involves a multiple parameter assessment, which inherently introduces greater variability in the results. Our group is working towards automatic segmentation algorithms to minimize variability in interpretation and reduce these drawbacks.26 Additionally, it should be considered that patients with pulmonary hypertension may present an elevated IVC and this could influence the predictive value of the IVC in our analysis. Previous studies,17 have demonstrated the prognostic value of VExUS; however, our findings support the notion that markers of renal function and congestion continue to play a central role in risk stratification for HF patients. Although VExUS may provide additional prognostic information, its predictive value could be limited by confounding variables and may benefit from being used in conjunction with other clinical parameters to enhance its utility in clinical practice.27
Strengths and limitationsThis study’s strengths include its prospective design, the standardized application of the VExUS protocol, and the multiparametric assessment of congestion. However, it has several drawbacks, including the lack of a universal definition for CN, the absence of data on pulmonary hypertension, the degree of right ventricular failure without TAPSE assessment, as well as its single-center design, which limit the generalizability of the results to other healthcare settings.
Future researchFuture research should explore whether VExUS-guided therapeutic interventions can improve long-term outcomes. Randomized controlled trials investigating VExUS as a decision-making tool for diuretic titration could provide valuable insights.
Conclusions- 1
A higher VExUS score is associated with an increased risk of adverse outcomes, including rehospitalization and all-cause mortality, within one year. This highlights the potential of VExUS as a prognostic marker in HF patients, although in our analysis, it was not identified as an independent predictor of outcomes.
- 2
The incidence of congestive nephropathy in patients admitted for HF is high and is related VExUS score, greater clinical congestion score and linked to higher doses of loop diuretics.
- 3
Urea levels, increased IVC diameter and male gender were found to be independent predictors of poor outcomes in HF.
This work was partially funded by Departamento de Ciencia, Universidad y Sociedad del Conocimiento, from the Gobierno de Aragón (Spain) (Research Groups B07_23R and T71_23D), Also by Project PID2022-139143OA-I00 funded by MICIU/AEI/ 10.13039/501100011033 and by ERDF/EU.
The following is Supplementary data to this article: